

Want to learn more about Phenolyzer? This is the right place! This section will go over with you about some common questions!
Phenolyzer takes as input a discrete list of phenotype terms and generates a list of candidate genes weighted by the chance of being associated with the phenotype, even in the absence of any genotype data.
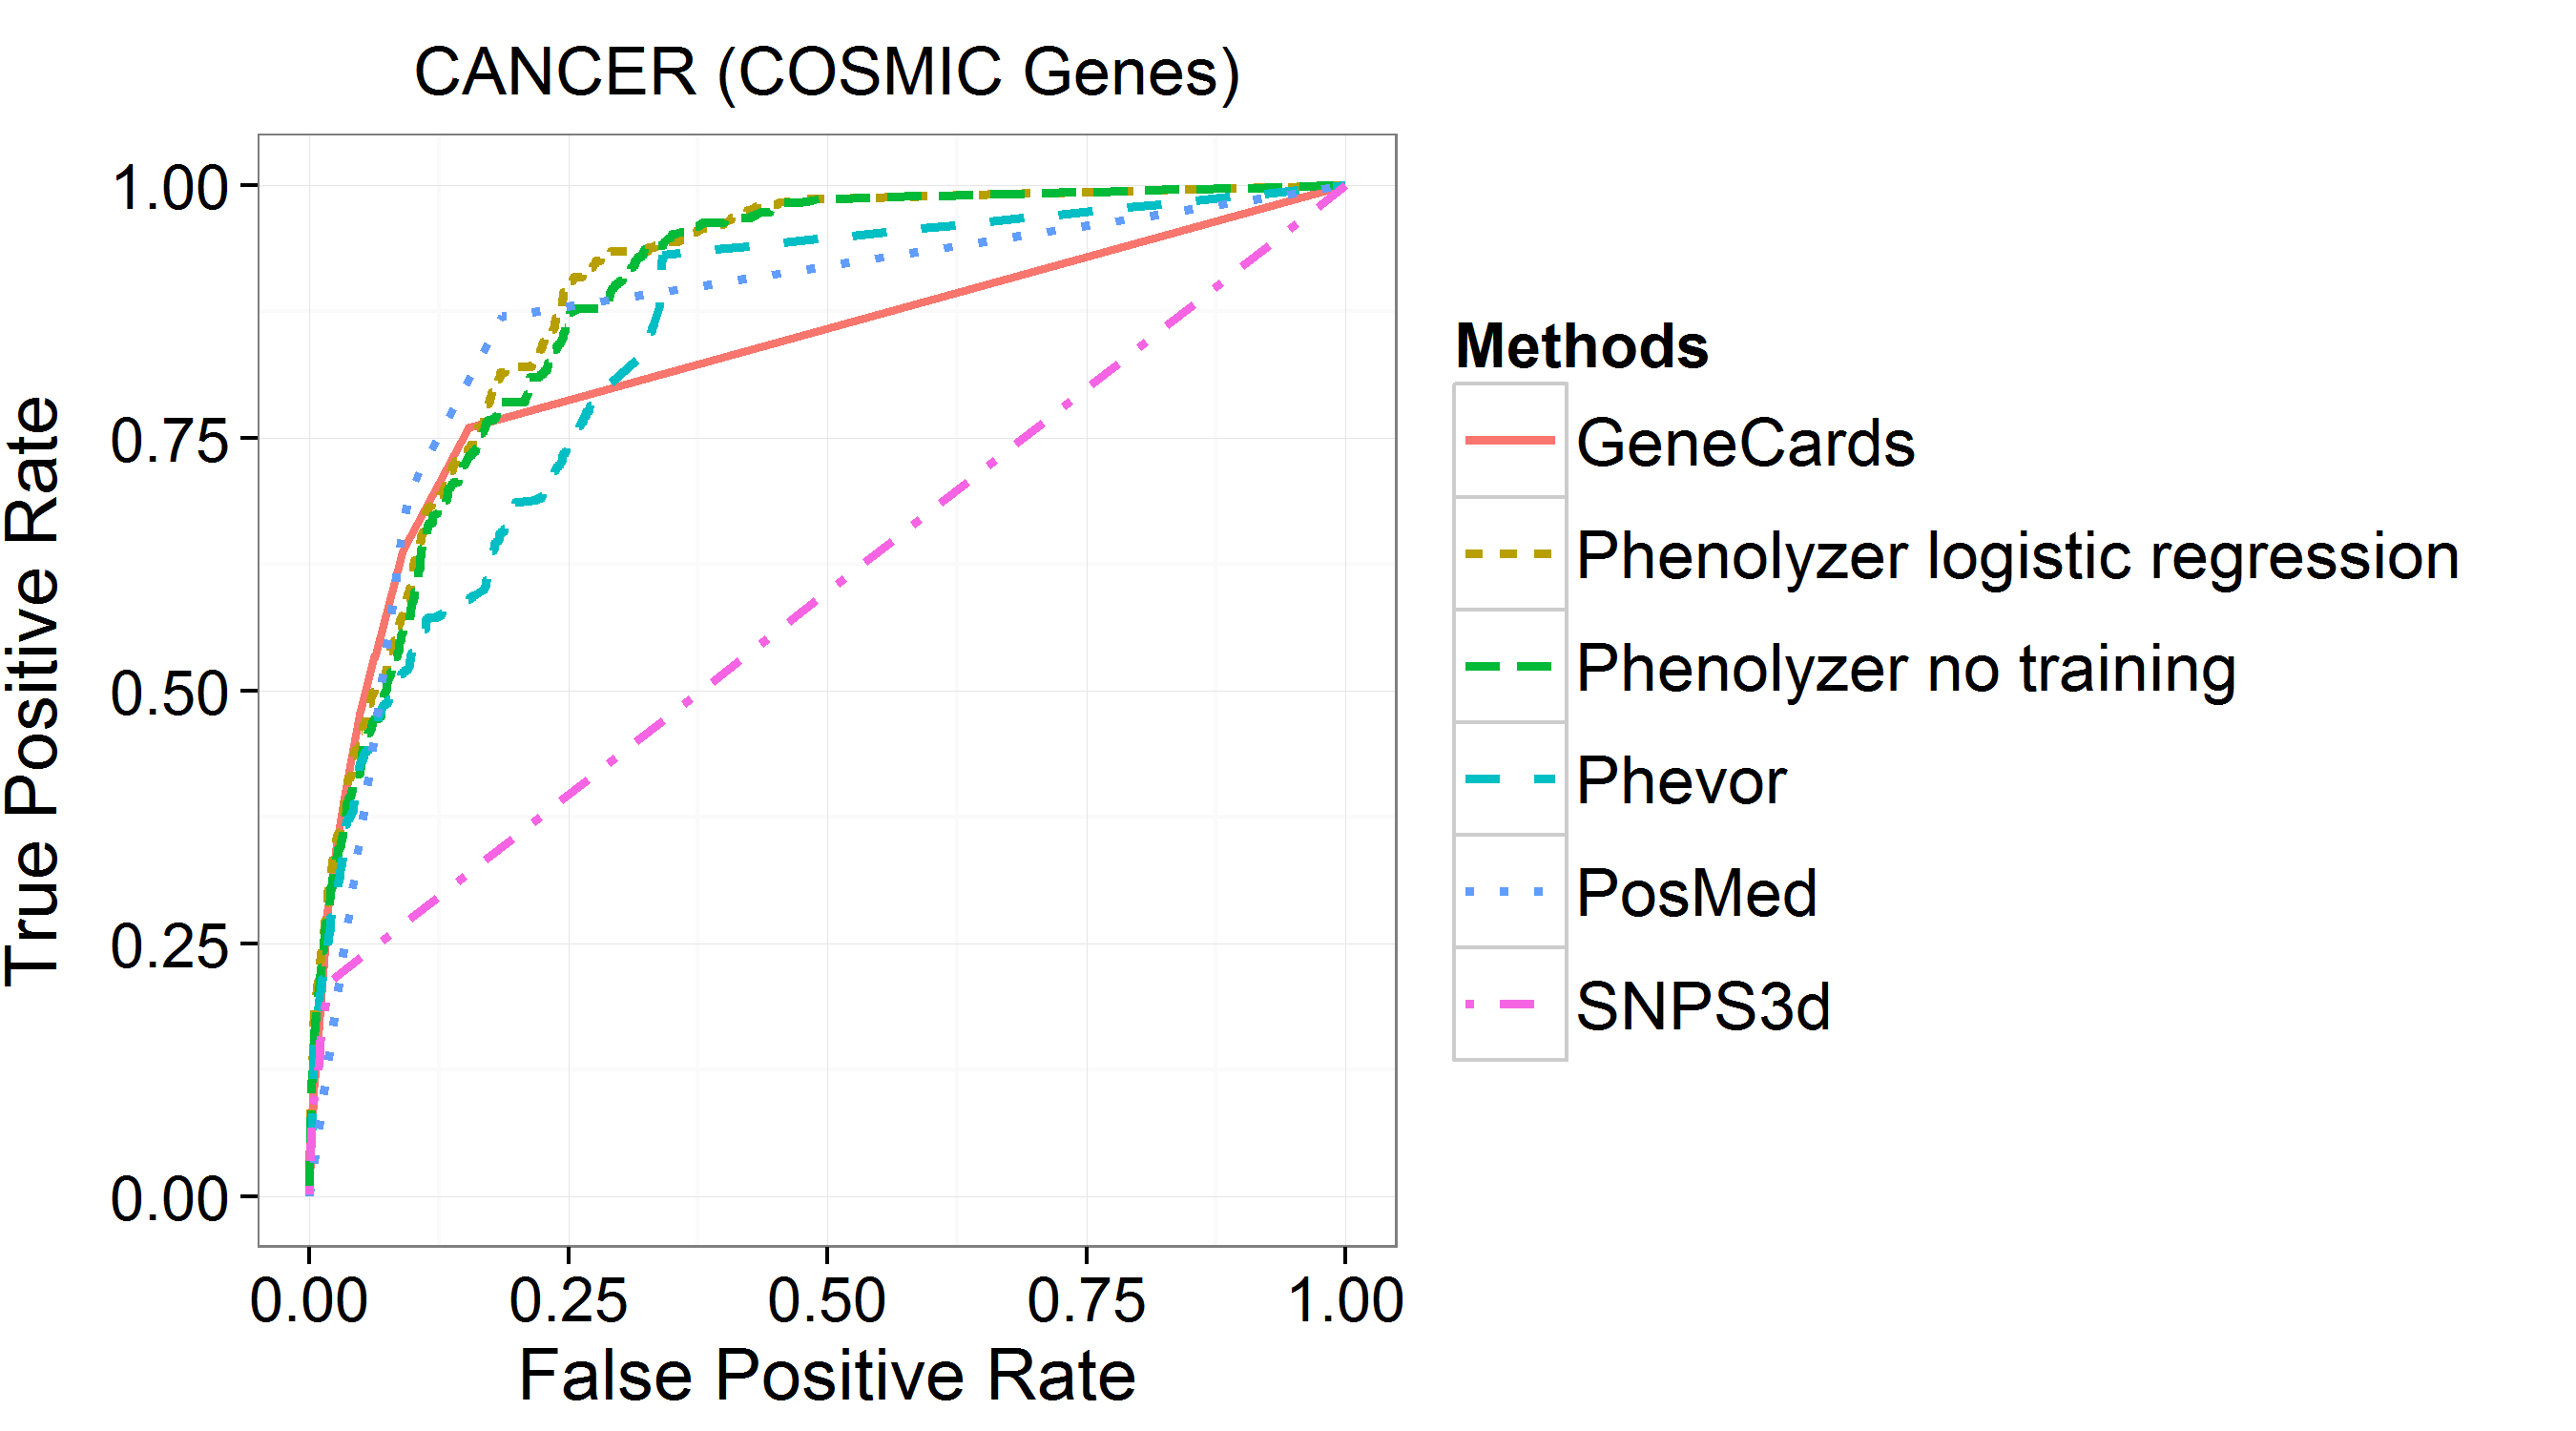
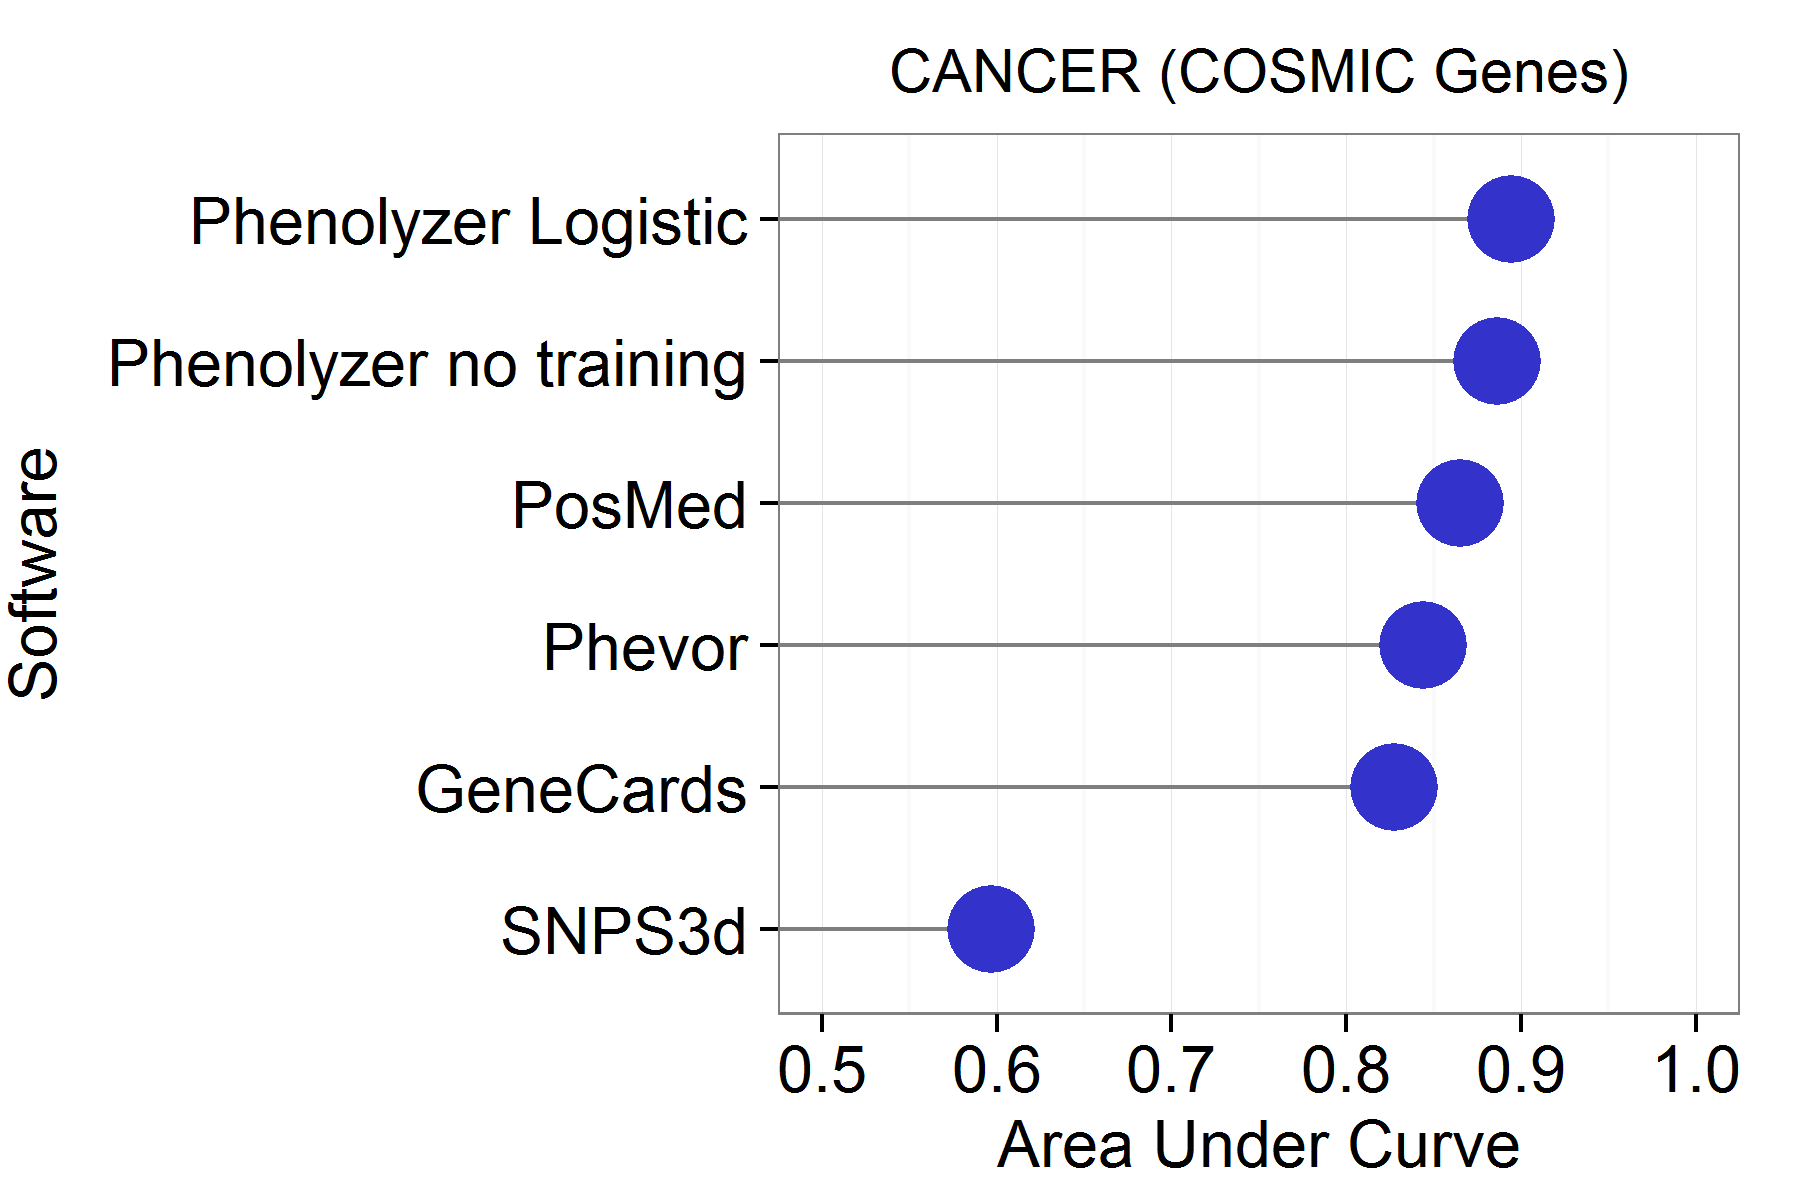
Below is the comparison between Phenolyzer and other gene/phevor prioritization tools, including Phevor, PosMed, SNP3d, Genecards.
Phenolyzer works the best to have the best ROC to find COSMIC cancer genes.
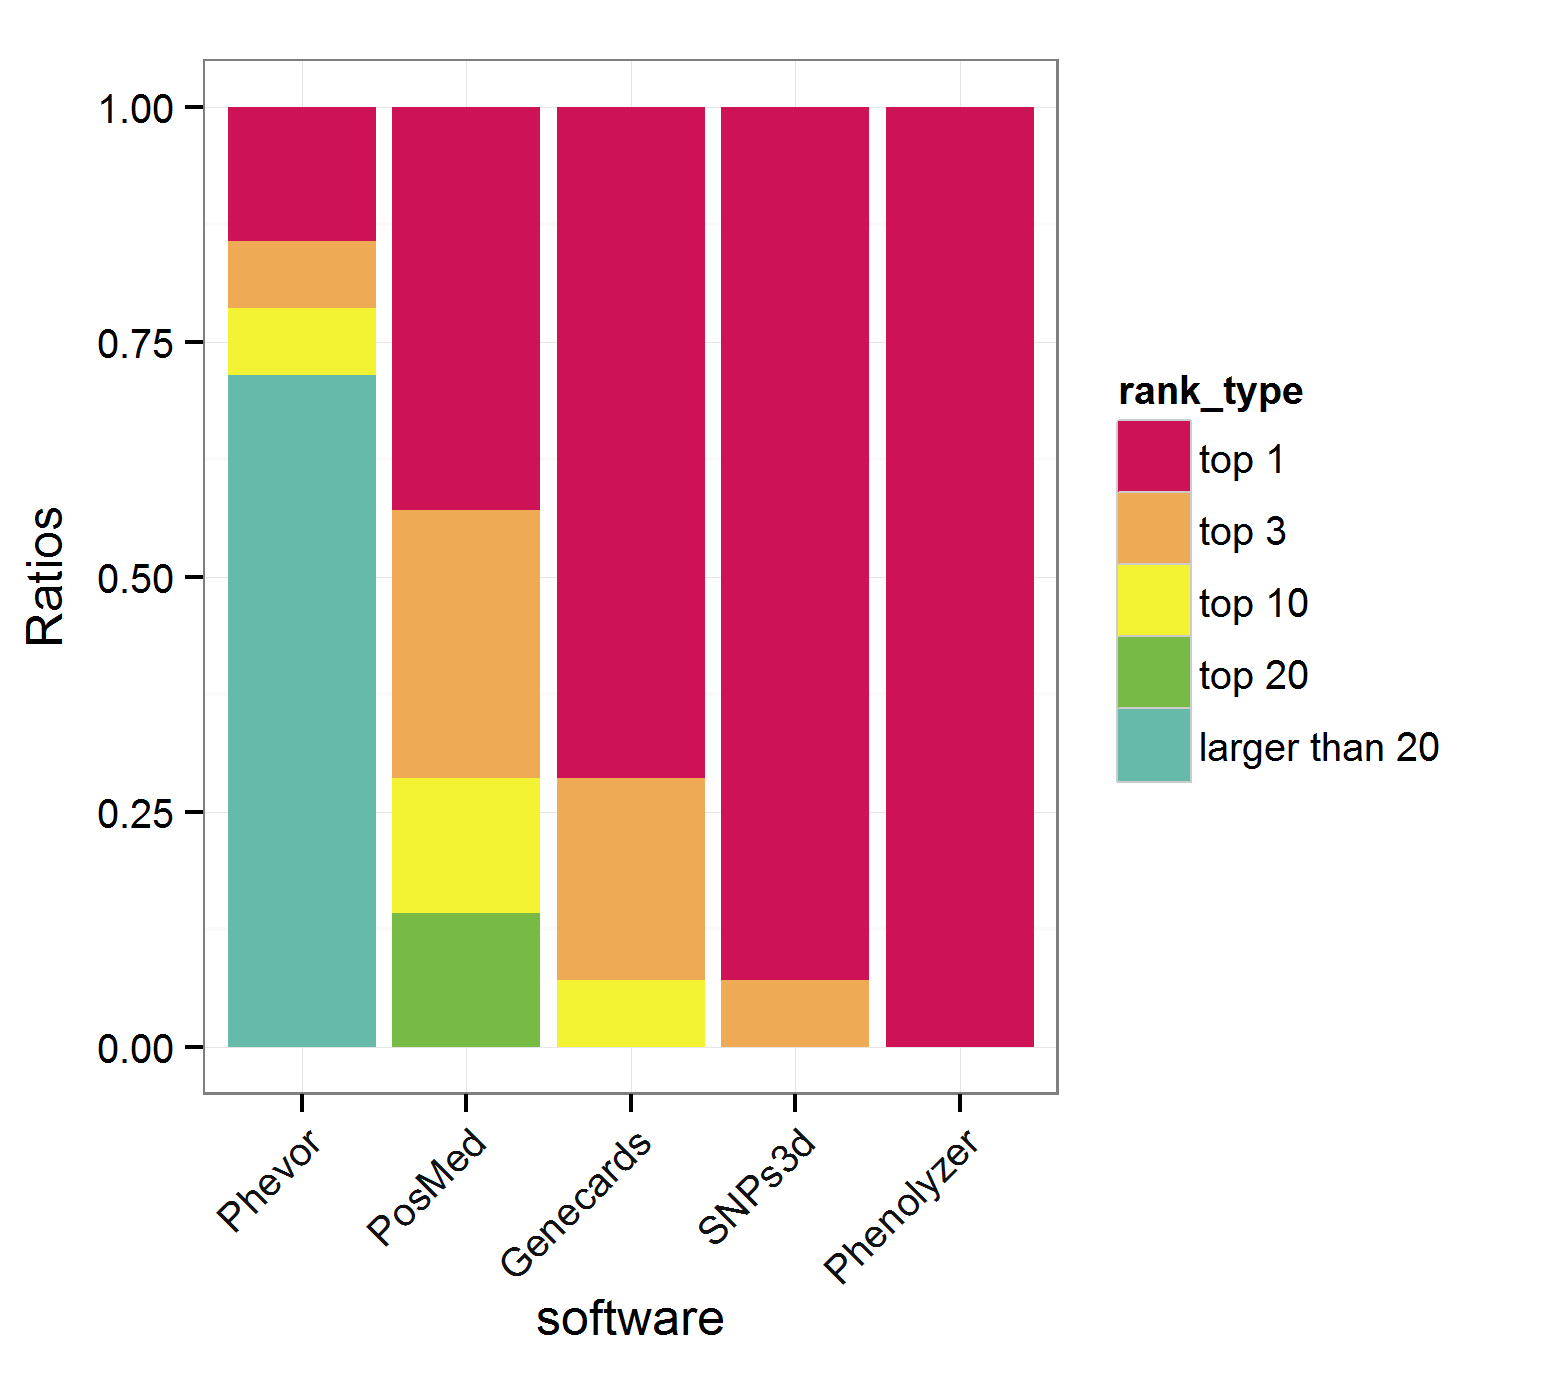
Also, for 14 classic monogenic disease genes, Phenolyzer ranked all of them as TOP1, the best among all these tools.
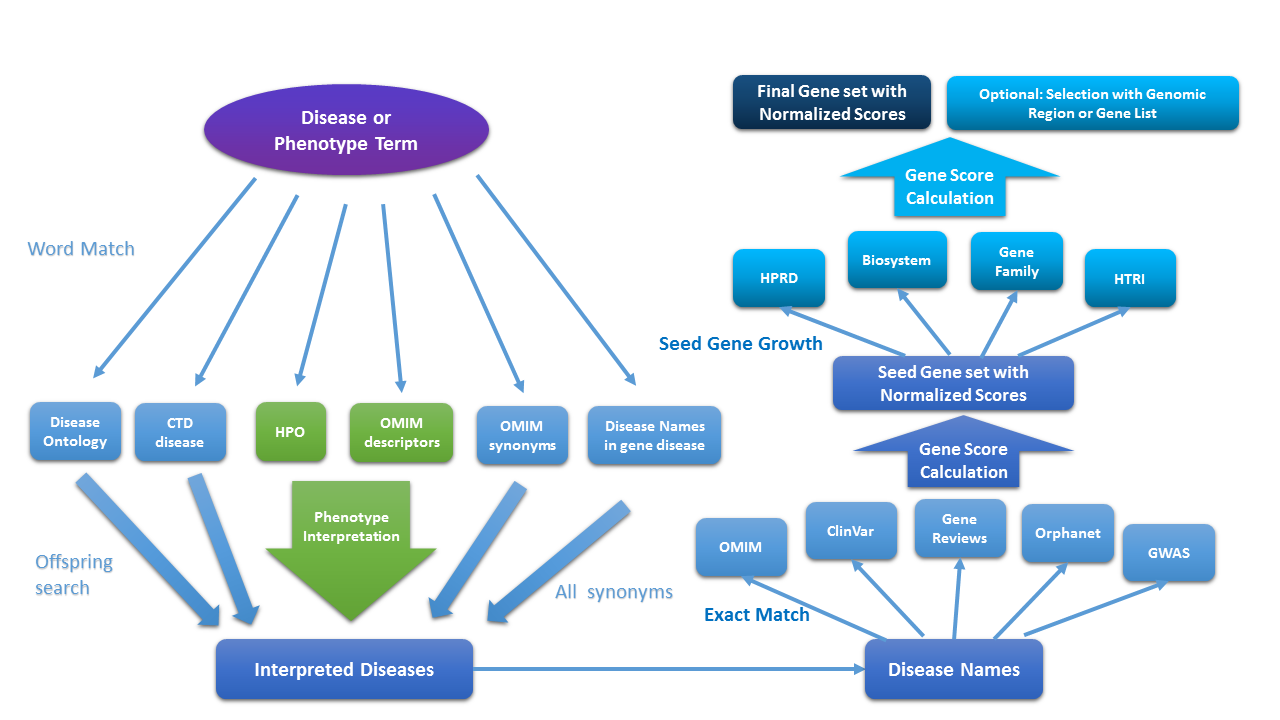
First, Phenolyzer interprets your term into a set of professional disease names;
Second, Phenolyzer finds all the genes having a reported association with all the diseases;
Thirdly, Phenolyzer grows the genes into gene-gene relation databases and get more genes;
Finally, Phenolyzer integrates all the infomation together and give gene scores.
1) Disease terms, separate by semicolon or return.
For example, 'Alzheimer disease'
2) Phenotype terms, if Phenotype interpretation is selected in advanced options.
For example, 'headache; fatigue'
Choose 'All Diseases' in Advanced Option
Phenolyzer needs to match your term in its database. If a term is not found, useually it is because your term is too long. Please try to break your long term into several short terms.
1) Disease Databases: CTD's Medic disease vocabulay, Disease Ontology, OMIM's disease synonyms
2) Gene-Disease Databass: OMIM (Online Mendelian In Man), NCBI's ClinVar, GeneReviews, Orphanet, GWAS Catalog
3) Gene-Gene Relation Databases: HPRD (Human Protein Relation Database), NCBI's Biosystem, HGNC Gene Family, HTRI(Human Transcription Interaction)
Please see the turorial page.
The network includes the top50 prioritized genes, and their associated diseases and relations with seed genes.
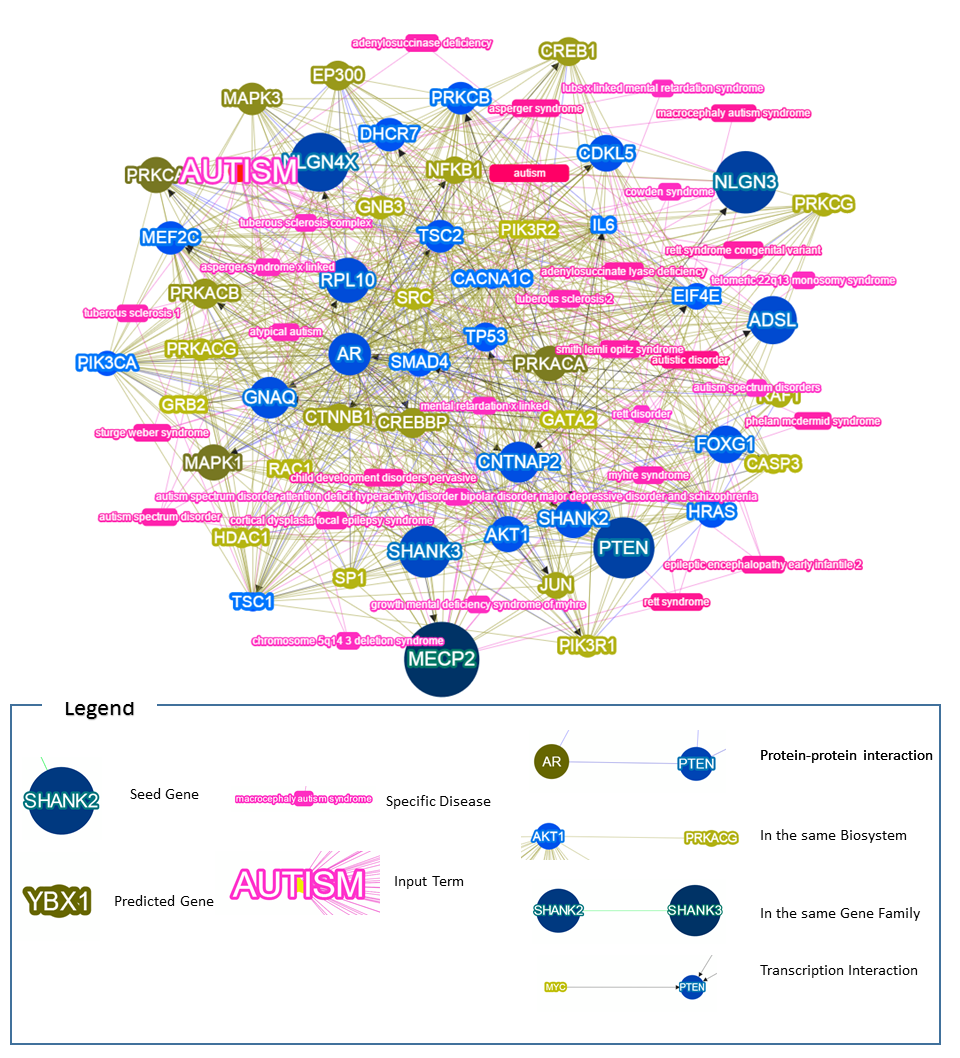
Round Nodes: Genes, blue as reported, and yellow as predicted. The bigger, the higher the score.
The darker, the higher the score.
Round-rectangles: Diseases, the longer and darker, the larger the contribution the disease.
Big Words: The input terms.
Blue edges: The Protein-protein interaction between two genes, based on the HPRD record.
Yellow edges: The In-the-same-Biosystem relation between two genes, based on NCBI's Biosystem record.
Green edges: The In-the-same-Gene-Family relation between two genes, based on HGNC's Gene Family database.
Black edges with Arrows: The transcription interaction between two genes, the direction of the arrow is from the transcription factor to the target.
The network is fully interactive, which means it is dynamic.
A simple trial is to double click an element, like clicking a gene. Then only the elements interacting with this gene will be shown.
Additionally, there are a set of swicthes and controllers below. The gene and disease elements could be turned on and off, also the names of genes and
diseases could be turned on and off. By default, the disease names are not shown as they are sometimes super long :).
Also, the different types of interactions could be slelectively shown by choosing one in the 'Edges' selection. The Layout is basically how the network
is shaped, by default it is force-driven, but by changing Layout one can make it more organized, like 'circle' layout:)
By the way, why not just save a photo of your network and show it to your friends? Just click the Save Photo button:)
As the workflow explained, Phenolyzer is not the god who knows everything you mean. It is just an advanced word matcher, which needs to exactly match your input terms with disease names in the databases. Thus it is encouraged to use multiple terms if you cannot describe something very precisely, in this case, you can just enter 'mental', or you can enter both, like 'mental retardation;mental disorder'.
Please compile your seed genes in the format(tab_delimited), and save the file in PHENOLYZER_DIR/lib/compiled_database:
Afterwards please use -addon_gg [your_filename] -addon_gg_weight [weight] in your command line.
| Entrez Gene A | Entrez Gene B | Evidence description | Normalized score (0 to 1) | Source (Pubmed ID) |
|---|---|---|---|---|
| BARD1 | DCAF7 | Mentha protein interaction | 0.126 | 22990118 |
Please compile your gene-gene interaction in the format below (tab-delimited), and save the file in PHENOLYZER_DIR/lib/compiled_database:
Afterwards please use -addon_gg [your_filename] -addon_weight [weight] in your command line.
| Entrez Gene | Disease name | Reference | Normalized score (0 to 1) | Source |
|---|---|---|---|---|
| CCR5 | acquired immunodeficiency syndrome | PUBMED:21502085 | 0.00595238095238095 | GAD |
1) we want to correctify a typo in the Nature Methods paper, in Page 5 Paragraph 5 Line 3, the 'wTXn-X0' should be 'wTxn - X0w0'. 2) The final score is the linear output instead of the logistic probability. All the weights except the intercept are promised to be positive. Thus to make sure our final score is positive, the negative intercept is deducted.
A delimiter like ';' or Enter means you treat them as different terms. Then any disease name containing 'acute''lymphocytic' or 'leukemia' will be considered. But we have a Weighted Sum system to combine your terms, thus the most specific term will be dominant and its corresponding genes will be prioritized on top. Multiple short terms should be considered when you want a better recall.
The structured output file is called 'network.json' and it is in the result URL directory.
One example is shown: http://phenolyzer.wglab.org/done/1/dIv3Tz6iaSVHA1_J/network.json
You need to modify the URL yourself as there is no direct link for download!